Archives
now browsing by author
Μαυρα Συννεφάκια πανω απο το ΧΑΑ!
GR Monthly (Big -11)

① Γενικός Δείκτης:
Δεν εχει αλλαξει κατι στην εικονα του ΓΔ απο τον Απριλιο του 2024 που ειχαμε δωσει ως στοχο τις 1.500 καi μετεπειτα διορθωση σε χαμηλοτερα επιπεδα με ενδιαμεσες στασεις τις 1.400 -> -1.350/00 και σε διασπαη 1.268/50 -> 1.120 / 1.100 πριν κινηθει σε νεα υψηλα. Παραμενει σε εξελιξη ενα 4αρι καθοδικο / διορθωτικο υποκυμα. Επισης δεν θα θελαμε διασπαση των 1.300 -1.285 μον. τλχ συντομα καθoσον ακυρωνεται ο Bullish μεσοπροθεσμος σχηματισμος σημαιας… ενω αν συμβει αργοτερα λογω της διολισθησης ο ΓΔ μπορει να βρεθει σε χαμηλοτερα επιπεδα χωρις να διασπασει πτωτικα το …
ASE (XAA) Γενικος Δεικτης 10 Δεκεμβριου 24

Mετα την επιβεβαιωση του βραχυπροθεσμου ανοδικου σεναριου μας, περιμεναμε να δουμε την Τριτη αν θα αυξηθουν οι πιθανοτητες επιβεβαιωσης του σεναριου και της διαδρομης του ΓΔ (ως προηγουμενα ποστ) να μην κινειται σε υψηλοτερα επιπεδα απο αυτα του καλοκαιριου και του Σεπτεμβριου, (τλχ στην παρουσα φαση και εβδομαδα) και ετσι παροτι διεσπασε τοπικα προηγουμενα υψηλα (που τα ειχαμε θεσει ως συντηρητικους ανοδικους στοχους απο τις 1.366 μον.) εδειξε αδυναμια *πειστικης* υπερβασης της πτωτικης trendline απο τα υψηλα της Ανοιξης…
Γενικος Δείκτης ΧΑΑ, Εβδομαδιαίο γραφημα.
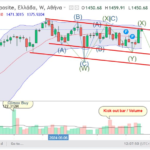
Kαλημερα και Καλη Εβδομαδα…
Φοβικη η κινηση του ΓΔ , ουτε οι αναβαθμισεις δεν μπορουν να λειτουργησουν ως καταλυτης! ( εδω δεν λειτουργησαν μεγαλων οικων των ΗΠΑ, του Γερμανικου θα λειτουργησει? )
Ισως χρειαστει την κινηση του “συμπιεσμενου ελατηριου” (Spring pattern), με εκκινηση απο χαμηλοτερα επιπεδα!
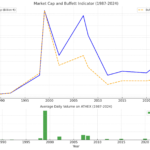
ASE (XAA) Buffet Indicator!
Ανακοίνωση

Δοκιμαστική Περίοδος 2025
Beta test: phase 1/3 ( Α τρίμηνο 2025)
Το WaveTrader.gr επανασχεδιάζεται και το περιεχόμενο του συμπληρώνεται σταδιακά τόσο με εκπαιδευτικά άρθρα όσο και με αναλύσεις, με στόχο να παρέχουμε στα μέλη μας τα εφόδια και τη γνώση, απόκτησης οικονομικής ευρωστίας μέσω της ενασχόλησης με τις αγορές, με μια ολιστική προσεγγιση παρέχοντας συνδυαστικη (intermarket) και κυριως ειλικρινη και ανεξαρτητη αναλυση των αγορων!
Επιπροσθετα στόχος μας ειναι το website αυτο να αποτελέσει ένα τόπο ανταλλαγής απόψεων μεταξύ των traders, μεσω της παροχης δυνατοτητας σχολιασμου κατω απο καθε αρθρο /καταχώρηση, αλλα και ενα εκπαιδευτικο εργαλειο και σημείο αναφοράς για ολους μας.
Κατά τη διάρκεια της δοκιμαστικής περιόδου, η περιήγηση / πρόσβαση σε ολες τις ενότητες θα είναι ελεύθερη στα μέλη του WaveTrader.gr
Για να έχετε ελεύθερη πρόσβαση εγγραφείτε με κλίκ στο λίνκ:
Εγγραφείτε Εδώ.
Ευχαριστούμε που επισκεφθήκατε το WaveTrader.gr
Σημ. Η περιήγηση του site, προϋποθέτει την ανεπιφύλακτη αποδοχή των όρων χρήσης και της Ρήτρας Μη Ευθύνης!
WaveTrader.gr
WaveTrader.gr is under re-construction and it’s content is gradually filled with training articles as well as, analysis and reports about capital markets, pending its full operation for privileged subscribers only, under a small monthly fee. Our vision is to provide to our member the know how and the means to obtain total financial freedom through the capital markets!
During the beta phase browsing the site will be permitted for free to all members. (Subscribed to the free demo subscription plan) If you want to have full access to the WaveTrader.gr please:
Thank You for visiting WaveTrader.gr
PS. Browsing the site assumes that you have accepted its terms of use and the Non-Liability clause!
ATH GR Index Seasonality (Εποχικοτητα) (07.24)

Μιλωντας για εποχικοτητα (σε καποια σχολια στο ΦΒ / Stock Jackal) / Seasonality… ριχνουμε μια ματια στους καλοκαιρινους μηνες… (και οχι μονο)
Mε απωλειες -1,9% εκλεισε ο Ιουνιος εναντι -2.7% του Μ.Ο. των τελευταιων 20 ετων!
GR Monthly (04.2024)

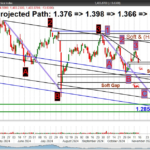
Ενδεικτικη κυματικη και τεχνικη long term προσεγγιση Γενικου Δεικτη ΧΑΑ (μηνιαιο γραφημα) με στηρiξεiς αντιστασεις, Fibonnacci ratios & projected targets / junctures.
Βραχυπροθεσμα κρατάμε την αρνητική απόκλιση του MACD που στο παρελθόν έδωσε “καλες” διορθώσεις…
Cairo Mezz

Μια προσπάθεια να δούμε που βρισκόμαστε κυματικα κατά Elliott στο Cairo…
σε Primary, Intermediate και Minor βαθμίδες και με περαιτέρω βραχυ-μεσοπροθεσμη ανάλυση.. .
( Αποποίηση Ευθυνης: με κάθε επιφύλαξη, DYOR, Do Your Own Research, δεν αποτελεί επενδυτικη συμβουλη κλπ…)
Trading with Bollinger Bands using confirmation from RSI
How to Trade Bollinger Bands

Bollinger bands
Bollinger Bands are envelopes which surround the price bars on a chart. Bollinger Bands are plotted two standard deviations away from a simple short-term moving average. This is the primary difference between Bollinger Bands and envelopes. Envelopes are plotted a fixed percentage above and below a moving average. Because standard deviation is a measure of volatility, the Bollinger Bands adjust themselves to the market conditions.
 D5 Creation